 Image Source: Sensu
In this blog, we will go step by step installing sensu, it's dependencies, grafana and finally creating beautiful graphs to monitor resources.
Overview:
Sensu is the open source monitoring event pipeline built to reduce operator burden and make developers and business owners happy. Started in 2011, Sensu’s flexible approach solves the challenges of monitoring hybrid-cloud and ephemeral infrastructures with scalable, automated workflows and integrations with tools you already use.
Grafana allows you to query, visualize, alert on and understand your metrics no matter where they are stored. Create, explore, and share dashboards with your team and foster a data driven culture.
Services:
We will need to install the following services to achieve the desired result.
- Redis
- Erlang
- RabbitMQ
- Sensu
- Carbon Cache
- Graphite
- Grafana
Installing Redis
sudo apt install redis-server -yInstalling Erlang (Dependency for RabbitMQ)
# Downloading signing key
sudo wget -O - "https://github.com/rabbitmq/signing-keys/releases/download/2.0/rabbitmq-release-signing-key.asc" | sudo apt-key add -

# Adding erlang repository to system
# xenial = Ubuntu 16.04
# bionic = Ubuntu 18.04
echo "deb https://dl.bintray.com/rabbitmq/debian xenial erlang" | sudo tee /etc/apt/sources.list.d/bintray.erlang.list

# Updating packages and Installing erlang
sudo apt update && apt install erlang-nox -y
Installing RabbitMQ
# Adding rabbitmq repository to system
# xenial = Ubuntu 16.04
# bionic = Ubuntu 18.04
echo "deb https://dl.bintray.com/rabbitmq/debian xenial main" | sudo tee /etc/apt/sources.list.d/bintray.rabbitmq.list

# Updating packages and Installing erlang
sudo apt update && apt install rabbitmq-server -y

# Starting rabbitmq-server
sudo service rabbitmq-server start

# Adding RabbitMQ vhost for Sensu
sudo rabbitmqctl add_vhost /sensu

# Creating RabbitMQ user for Sensu
sudo rabbitmqctl add_user sensu secret
sudo rabbitmqctl set_permissions -p /sensu sensu ".*" ".*" ".*"
Installing Sensu
# Downloading signing key
sudo wget -q http://sensu.global.ssl.fastly.net/apt/pubkey.gpg -O- | sudo apt-key add -

# Adding sensu repository to system
echo "deb http://sensu.global.ssl.fastly.net/apt sensu main" | sudo tee /etc/apt/sources.list.d/sensu.list

# Updating packages and Installing sensu
sudo apt update && sudo apt install sensu -y
Installing WizardVan
# Installing git
sudo apt install git -y

# Downloading repository
git clone https://github.com/grepory/wizardvan.git

# Copying extensions
cd wizardvan
sudo cp -R lib/sensu/extensions/* /etc/sensu/extensions
Installing Mailer
/opt/sensu/embedded/bin/sensu-install -p mailerSensu reads configuration from two locations:
- /etc/sensu/config.json
- /etc/sensu/conf.d/
I will be creating individual file for each config and store it in /etc/sensu/conf.d/. However, you can use a single file /etc/sensu/config.json to configure sensu.
Learn more about Sensu Configuration.
Configuring Relay Handler
sudo mkdir -p /etc/sensu/conf.d/handlers

echo '{
    "relay": {
        "graphite": {
            "host": "localhost",
            "port": 2003,
            "max_queue_size": 0
        }
    }
}' | sudo tee /etc/sensu/conf.d/handlers/relay.json
Configuring Mailer Handler
echo '{
    "handlers": {
        "mailer": {
            "type": "pipe",
            "filter": "state-change-only",
            "command": "/opt/sensu/embedded/bin/handler-mailer.rb"
        }
    }
}' | sudo tee /etc/sensu/conf.d/handlers/mailer.json
Configuring Mailer
echo '{
    "mailer": {
        "admin_gui": "http://SENSU_SERVER_IP:3000",
        "mail_from": "abc@xyz.com",
        "mail_to": "abc@xyz.com",
        "smtp_address": "localhost",
        "smtp_port": "25",
        "smtp_domain": "localhost"
    }
}' | sudo tee /etc/sensu/conf.d/mailer.json
Note: You can use Postfix with AWS SES for sending mails.
Configuring Transport
echo '{
    "transport": {
        "name": "rabbitmq",
        "reconnect_on_error": true
    }
}' | sudo tee /etc/sensu/conf.d/transport.json
Configuring Sensu API
echo '{
    "api": {
        "host": "localhost",
        "bind": "0.0.0.0",
        "port": 4567
    }
}' | sudo tee /etc/sensu/conf.d/api.json
Configuring Redis
echo '{
    "redis": {
        "host": "localhost",
        "port": 6379
    }
}' | sudo tee /etc/sensu/conf.d/redis.json
Configuring RabbitMQ
echo '{
    "rabbitmq": {
        "host": "localhost",
        "port": 5672,
        "vhost": "/sensu",
        "user": "sensu",
        "password": "secret"
    }
}' | sudo tee /etc/sensu/conf.d/rabbitmq.json
Before we move forward please not Sensu provides two different types of checks:
- Metric Checks: These are used for visualizing data in tools like grafana.
- Standard Checks: These are used to raise warning/alerts.
Configuring CPU Checks
echo '{
    "checks": {
        "checks-linux-cpu-usage": {
            "command": "/opt/sensu/embedded/bin/check-cpu.rb -w 80 -c 90",
            "interval": 30,
            "subscribers": [
                "linux"
            ],
            "handlers": [
                "mailer"
            ]
        }
    }
}' | sudo tee /etc/sensu/conf.d/checks_cpu_usage_linux.json

# Only if you want to monitor Windows client
echo '{
    "checks": {
        "checks-win-cpu-usage": {
            "command": "c:\\opt\\sensu\\embedded\\bin\\ruby.exe c:\\opt\\sensu\\embedded\\bin\\check-windows-cpu-load.rb -w 80 -c 90",
            "interval": 30,
            "subscribers": [
                "win"
            ],
            "handlers": [
                "mailer"
            ]
        }
    }
}' | sudo tee /etc/sensu/conf.d/checks_cpu_usage_win.json
Configuring Disk Checks
echo '{
    "checks": {
        "checks-linux-disk-usage": {
            "command": "/opt/sensu/embedded/bin/check-disk-usage.rb -w 80 -c 90",
            "interval": 30,
            "subscribers": [
                "linux"
            ],
            "handlers": [
                "mailer"
            ]
        }
    }
}' | sudo tee /etc/sensu/conf.d/checks_disk_usage_linux.json

# Only if you want to monitor Windows client
echo '{
    "checks": {
        "checks-win-disk-usage": {
            "command": "c:\\opt\\sensu\\embedded\\bin\\ruby.exe c:\\opt\\sensu\\embedded\\bin\\check-windows-disk.rb -w 80 -c 90",
            "interval": 30,
            "subscribers": [
                "win"
            ],
            "handlers": [
                "mailer"
            ]
        }
    }
}' | sudo tee /etc/sensu/conf.d/checks_disk_usage_win.json
Configuring Memory Checks
echo '{
    "checks": {
        "checks-linux-memory-usage": {
            "command": "/opt/sensu/embedded/bin/check-memory-percent.rb -w 80 -c 90",
            "interval": 30,
            "subscribers": [
                "linux"
            ],
            "handlers": [
                "mailer"
            ]
        }
    }
}' | sudo tee /etc/sensu/conf.d/checks_memory_usage_linux.json

# Only if you want to monitor Windows client
echo '{
    "checks": {
        "checks-win-memory-usage": {
            "command": "c:\\opt\\sensu\\embedded\\bin\\ruby.exe c:\\opt\\sensu\\embedded\\bin\\check-windows-ram.rb -w 80 -c 90",
            "interval": 30,
            "subscribers": [
                "win"
            ],
            "handlers": [
                "mailer"
            ]
        }
    }
}' | sudo tee /etc/sensu/conf.d/checks_memory_usage_win.json
Configuring CPU Metrics
echo '{
    "checks": {
        "metrics-linux-cpu-usage": {
            "type": "metric",
            "command": "/opt/sensu/embedded/bin/metrics-cpu-pcnt-usage.rb",
            "interval": 30,
            "subscribers": [
                "linux"
            ],
            "handlers": [
                "relay"
            ]
        }
    }
}' | sudo tee /etc/sensu/conf.d/metrics_cpu_usage_linux.json

# Only if you want to monitor Windows client
echo '{
    "checks": {
        "metrics-win-cpu-usage": {
            "type": "metric",
            "command": "c:\\opt\\sensu\\embedded\\bin\\metric-windows-cpu-load.rb.bat",
            "interval": 30,
            "subscribers": [
                "win"
            ],
            "handlers": [
                "relay"
            ]
        }
    }
}' | sudo tee /etc/sensu/conf.d/metrics_cpu_usage_win.json
Configuring Memory Metrics
echo '{
    "checks": {
        "metrics-linux-memory-usage": {
            "type": "metric",
            "command": "/opt/sensu/embedded/bin/metrics-memory-percent.rb",
            "interval": 30,
            "subscribers": [
                "linux"
            ],
            "handlers": [
                "relay"
            ]
        }
    }
}' | sudo tee /etc/sensu/conf.d/metrics_memory_usage_linux.json

# Only if you want to monitor Windows client
echo '{
    "checks": {
        "metrics-win-memory-usage": {
            "type": "metric",
            "command": "c:\\opt\\sensu\\embedded\\bin\\metric-windows-ram-usage.rb.bat",
            "interval": 30,
            "subscribers": [
                "win"
            ],
            "handlers": [
                "relay"
            ]
        }
    }
}' | sudo tee /etc/sensu/conf.d/metrics_memory_usage_win.json
Configuring Disk Metrics
echo '{
    "checks": {
        "metrics-linux-disk-usage": {
            "type": "metric",
            "command": "/opt/sensu/embedded/bin/metrics-disk-usage.rb",
            "interval": 30,
            "subscribers": [
                "linux"
            ],
            "handlers": [
                "relay"
            ]
        }
    }
}' | sudo tee /etc/sensu/conf.d/metrics_disk_usage_linux.json

# Only if you want to monitor Windows client
echo '{
    "checks": {
        "metrics-win-disk-usage": {
            "type": "metric",
            "command": "c:\\opt\\sensu\\embedded\\bin\\metric-windows-disk-usage.rb.bat",
            "interval": 30,
            "subscribers": [
                "win"
            ],
            "handlers": [
                "relay"
            ]
        }
    }
}' | sudo tee /etc/sensu/conf.d/metrics_disk_usage_win.json
Note: Sensu produces output in the format of hostname.metric. In case your system uses FQDNs, your output might be as long as ip-172-31-12-62.ap-south-1.compute.internal.metric. If you want to shorten this down add --scheme $(hostname --short) to your metric check. After adding, it should look like:
"command": "/opt/sensu/embedded/bin/metrics-disk-usage.rb --scheme $(hostname --short)"
This will shorten the output to ip-172-31-12-62.metric.
Starting services
sudo service sensu-server start
sudo service sensu-api start
Finally, we are done with Sensu setup. It's now time to install carbon, graphite and grafana to visualize the checks/metrics.
Installing Carbon Cache
sudo DEBIAN_FRONTEND=noninteractive apt -q -y --force-yes install graphite-carbon
echo "CARBON_CACHE_ENABLED=true" > /etc/default/graphite-carbon
service carbon-cache start
Installing Graphite
sudo apt install graphite-web apache2 libapache2-mod-wsgi -y
chown _graphite /var/lib/graphite
sudo -u _graphite graphite-manage syncdb --noinput
rm -f /etc/apache2/sites-enabled/000-default.conf
cp /usr/share/graphite-web/apache2-graphite.conf /etc/apache2/sites-enabled/graphite.conf
service apache2 restart
Installing Grafana
# Adding repository to sources.list
echo "deb https://packages.grafana.com/oss/deb stable main" | sudo tee /etc/apt/sources.list.d/grafana.list

# Download GPG Key
sudo curl https://packages.grafana.com/gpg.key | sudo apt-key add -

# (Optional) Some older versions of Ubuntu/Debian may need apt-transport-https to fetch packages over HTTPS
sudo apt install apt-transport-https -y

# Updating packages and Installing Grafana
sudo apt update && apt install grafana -y

# Starting grafana
sudo service grafana-server start
You can access Grafana Dashboard by visting http://SERVER_PUBLIC_IP_ADDRESS:3000
Default Credentials
 =================
| Username: admin |
| Password: admin |
 =================

Autostart services on boot
sudo update-rc.d rabbitmq-server defaults
sudo update-rc.d sensu-server defaults
sudo update-rc.d sensu-api defaults
sudo update-rc.d carbon-cache defaults
sudo update-rc.d apache2 defaults
sudo systemctl enable grafana-server.service
This brings us to the end of Sensu Server setup.
Now, we are going to setup two clients: a linux and another one will be windows. So let's continue.
Installing EPEL
sudo yum install epel-release -yCreating repository configuration file
echo '[sensu]
name=sensu
baseurl=https://sensu.global.ssl.fastly.net/yum/$releasever/$basearch/
gpgkey=https://repositories.sensuapp.org/yum/pubkey.gpg
gpgcheck=1
enabled=1' | sudo tee /etc/yum.repos.d/sensu.repo
Note: Use 7 in lieu of $releasever and x86_64 in lieu of $basearch for Amazon Linux. NO change required for Red Hat and CentOS as they will automatically pick the values.
Installing Sensu
sudo yum install sensu -yInstalling Sensu Plugins
cd /opt/sensu/embedded/bin/

sensu-install -p cpu-checks
sensu-install -p disk-checks
sensu-install -p memory-checks
Configuring Transport
echo '{
    "transport": {
        "name": "rabbitmq",
        "reconnect_on_error": true
    }
}' | sudo tee /etc/sensu/conf.d/transport.json
Configuring RabbitMQ
echo '{
    "rabbitmq": {
        "host": "SENSU_SERVER_IP",
        "port": 5672,
        "vhost": "/sensu",
        "user": "sensu",
        "password": "secret"
    }
}' | sudo tee /etc/sensu/conf.d/rabbitmq.json
Note: Replace SENSU_SERVER_IP with Sensu server real IP address.
Configuring Sensu Client
echo '{
    "client": {
        "name": "centos-client",
        "address": "localhost",
        "subscriptions": [
            "linux"
        ]
    }
}' | sudo tee /etc/sensu/conf.d/client.json
Starting Sensu Client
sudo service sensu-client startAutostart service on boot
sudo chkconfig sensu-client onInstalling Sensu
Download Sensu from official site and install it. Default install location: c:\opt\sensu\


Navigate to c:\opt\sensu\ and create a directory conf.d to store configuration files.
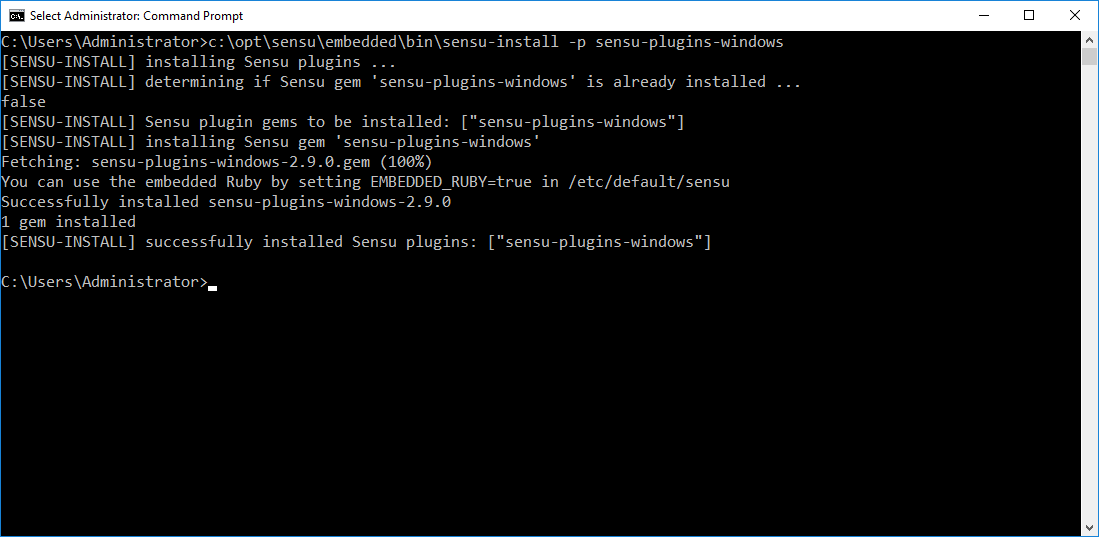
Installing Plugins
Open Command Prompt in Administrator mode and run the following command:
c:\opt\sensu\embedded\bin\sensu-install -p sensu-plugins-windows
Configuring Sensu
Create config file c:\opt\sensu\conf.d\client.json and save it with the following setting:
{
    "client": {
        "name": "win-client",
        "address": "127.0.0.1",
        "subscriptions": [
            "win"
        ]
    }
}
Configuring Transport
Create config file c:\opt\sensu\conf.d\transport.json and save it with the following setting:
{
    "transport": {
        "name": "rabbitmq",
        "reconnect_on_error": true
    }
}
Configuring RabbitMQ
Create config file c:\opt\sensu\conf.d\rabbitmq.json and save it with the following setting:
{
    "rabbitmq": {
        "host": "SENSU_SERVER_IP",
        "port": 5672,
        "vhost": "/sensu",
        "user": "sensu",
        "password": "secret"
    }
}
Creating Sensu Client as a service
The Sensu Core MSI package includes a Sensu client service wrapper, allowing Sensu to be registered as a Windows service. The Sensu client service wrapper uses an XML configuration file to configure the sensu-client. The XML file is located at c:\opt\sensu\bin\sensu-client.xml
Open Command Prompt in Administrator mode and run the following command to create a Windows service for Sensu Client:
sc create sensu-client start= delayed-auto binPath= c:\opt\sensu\bin\sensu-client.exe DisplayName= "Sensu Client"Starting Sensu
Use services.msc utility or command prompt to start/stop the service.
sc start sensu-client
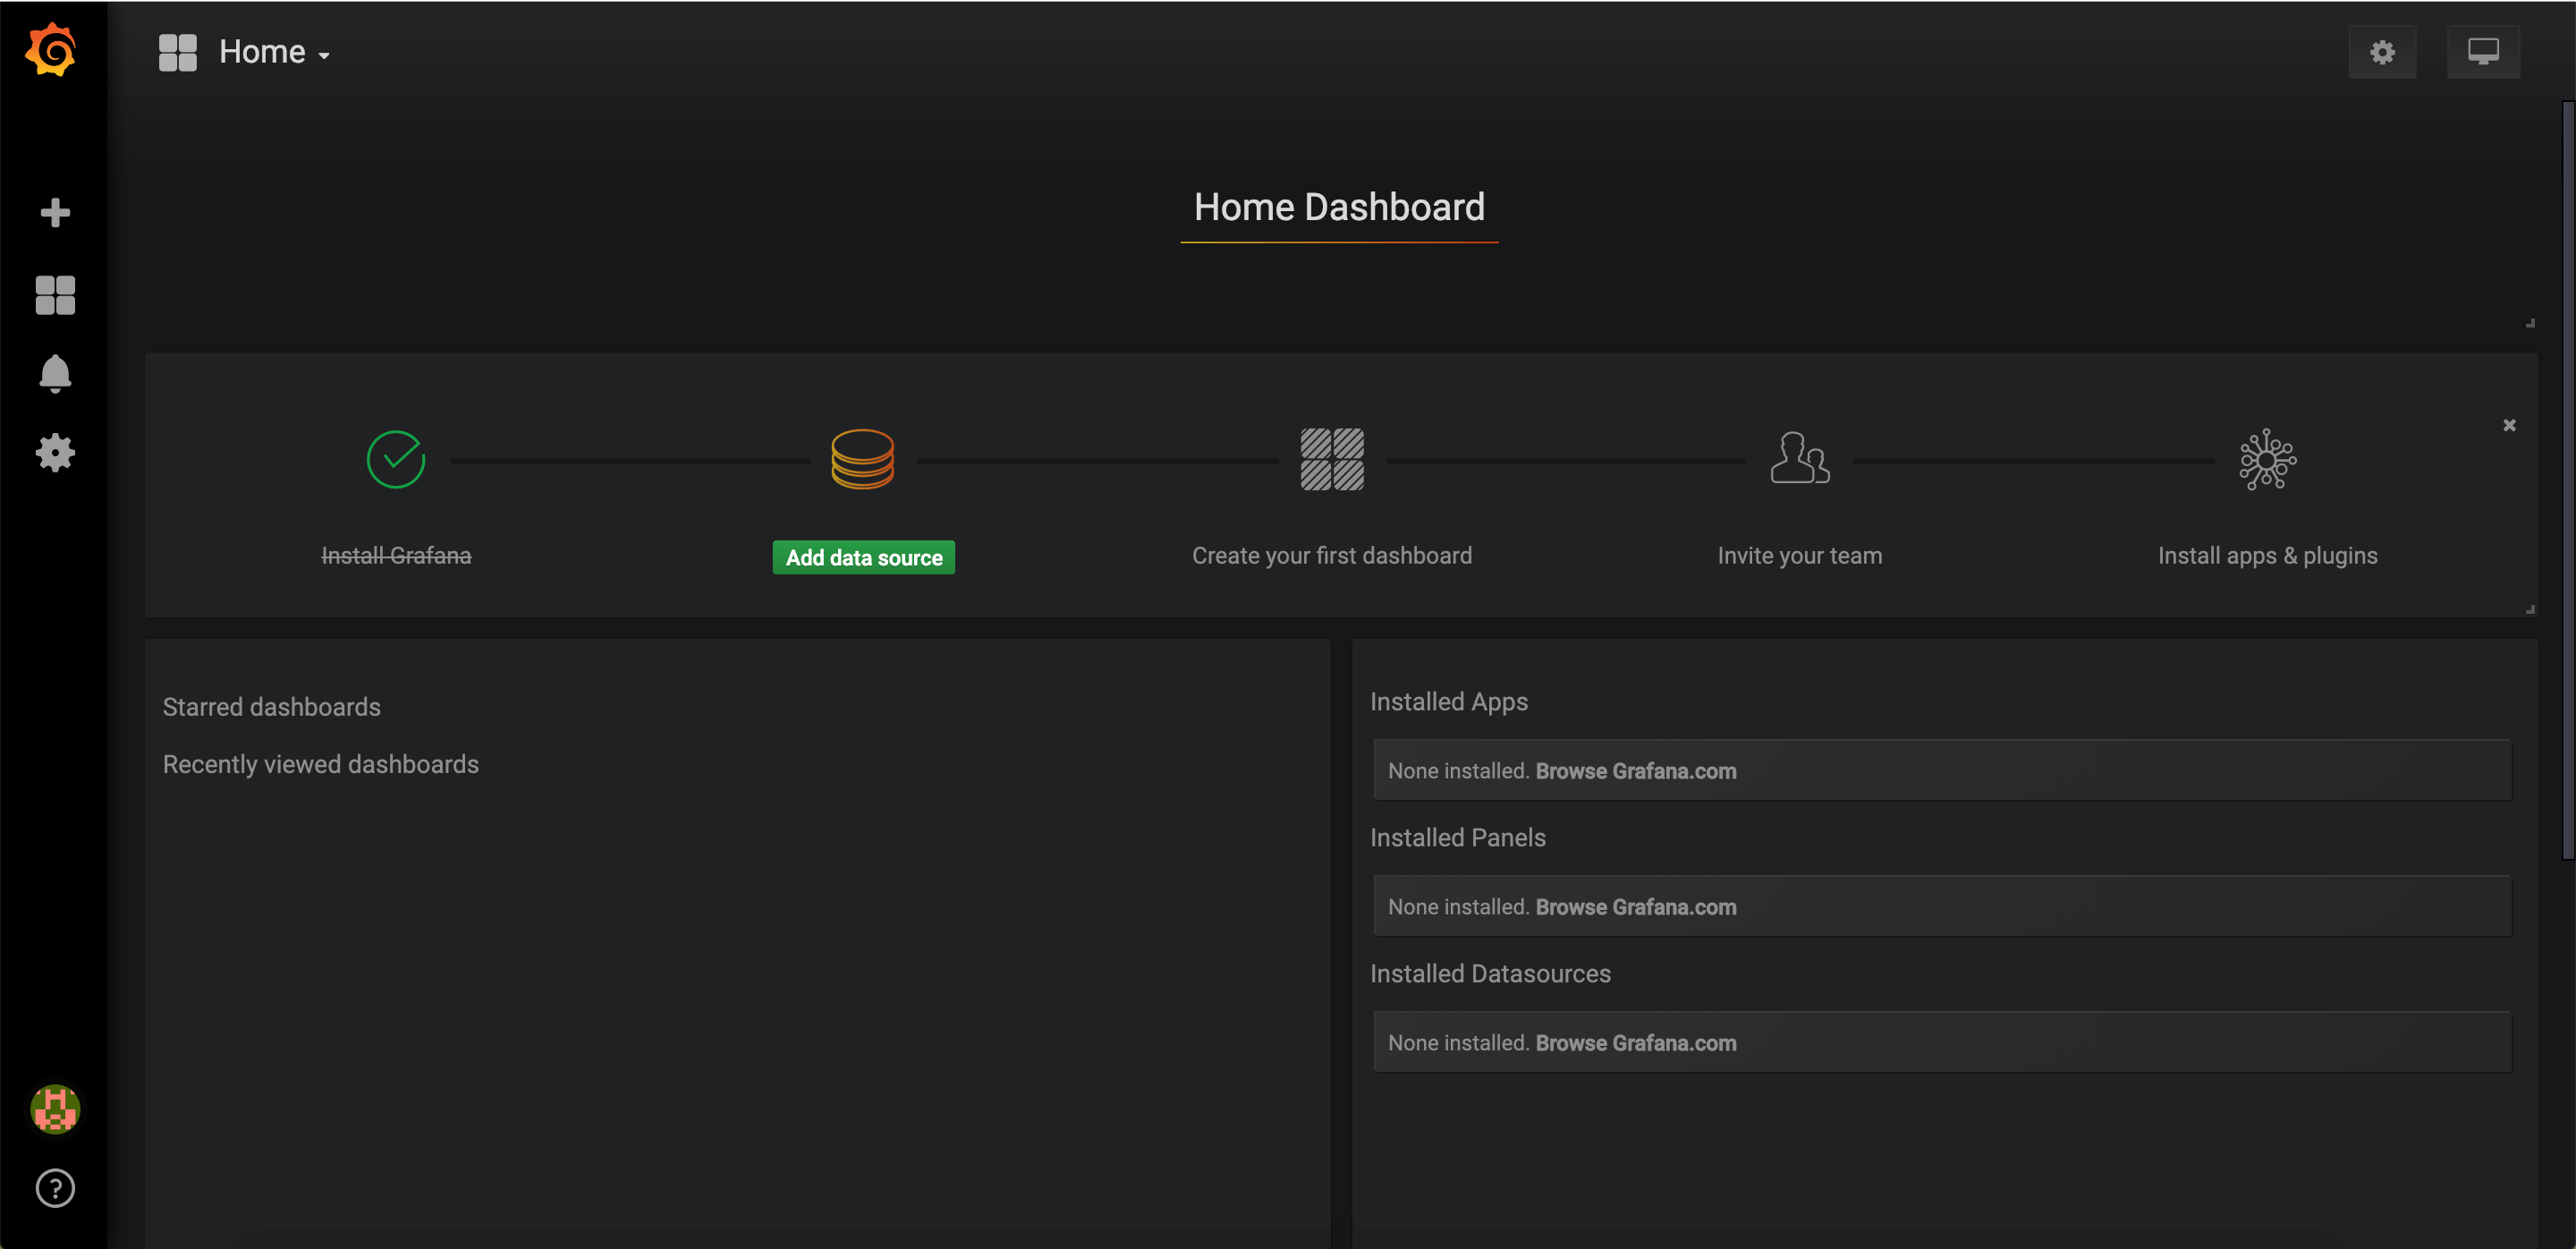
sc stop sensu-clientLogin to Grafana using the default credentials mentioned above.
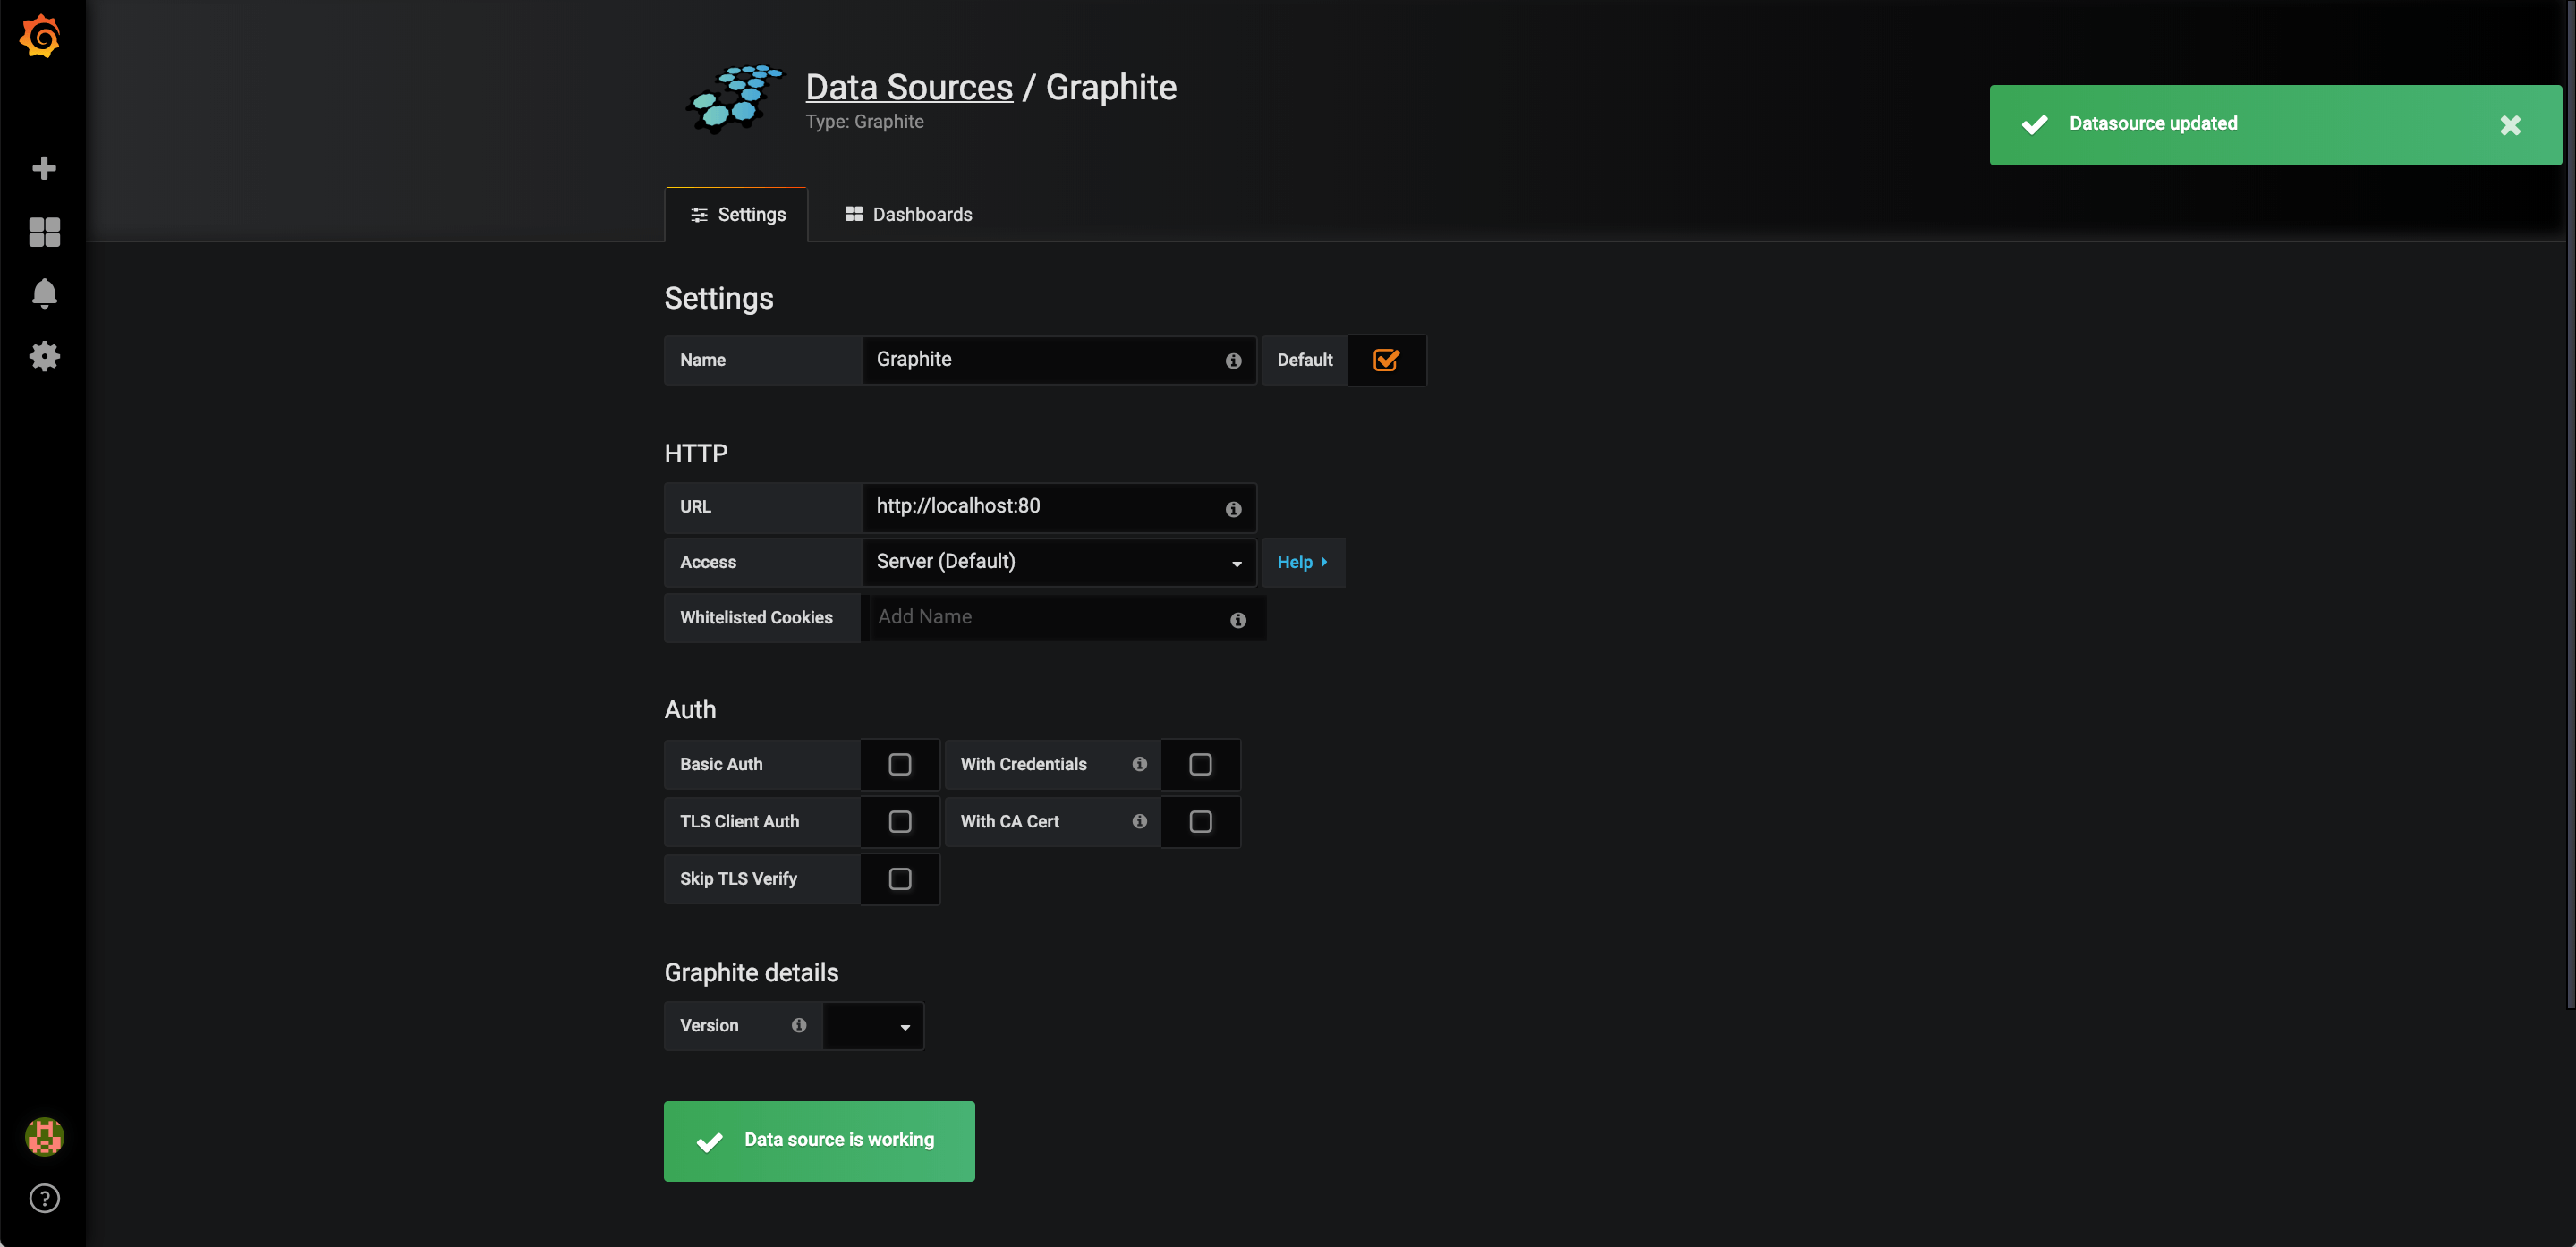
Adding Datasource
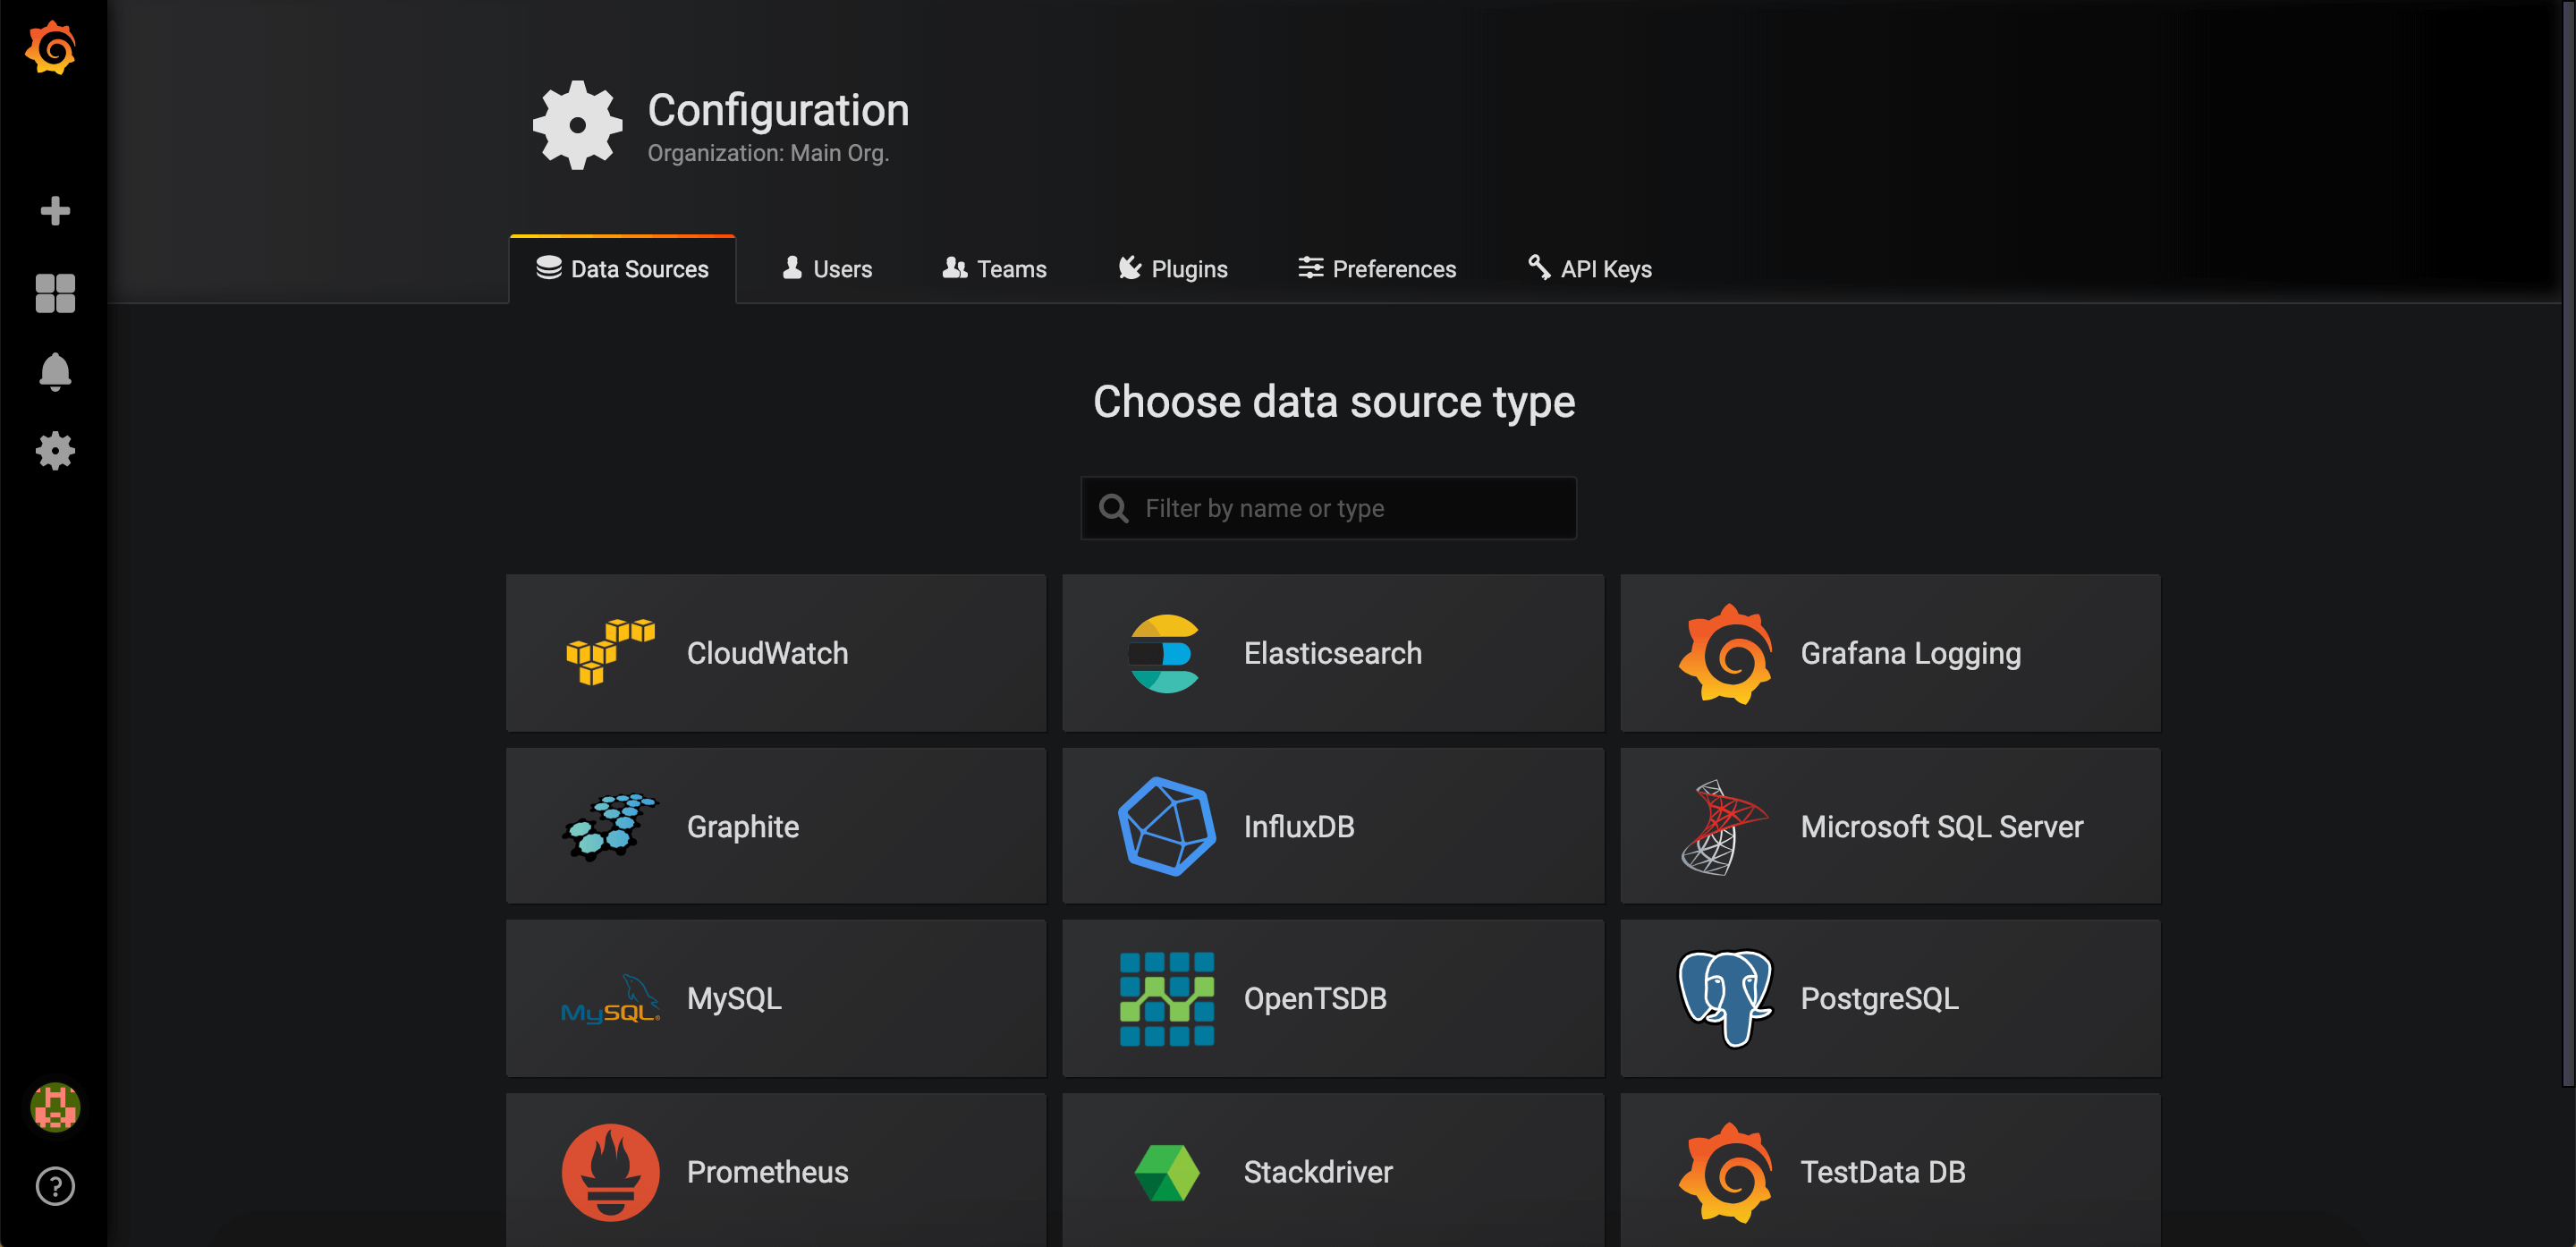
Click on Add data source.
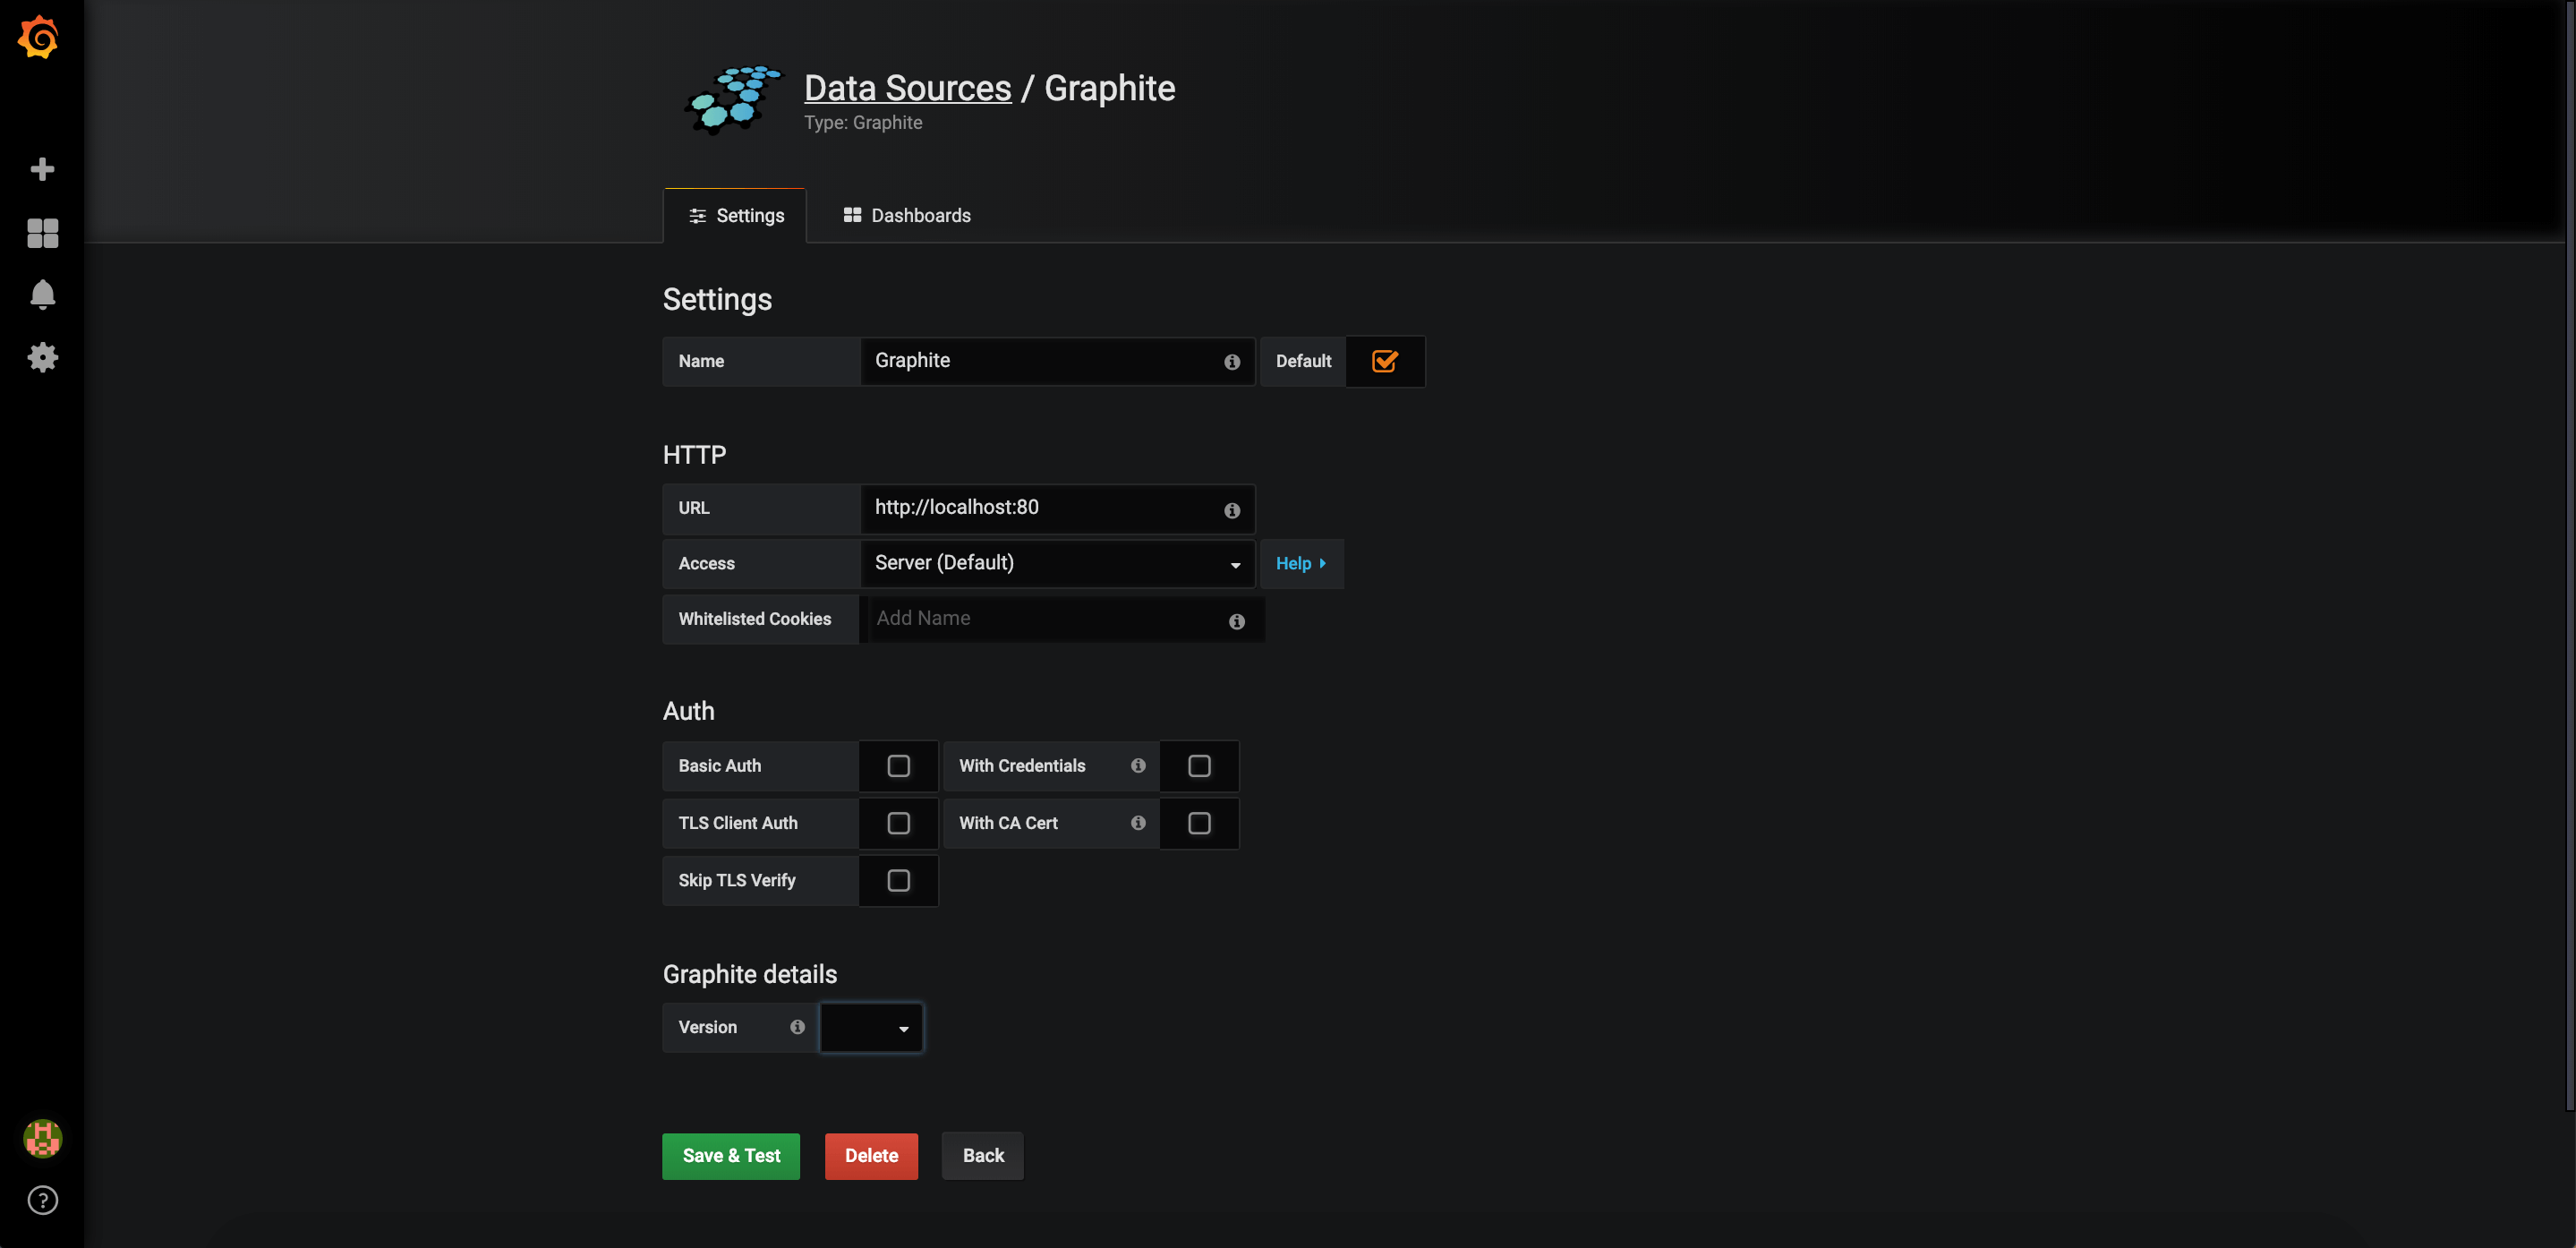
Select Graphite.
Configure Graphite and click on Save & Test button. You should receive two success notifications.
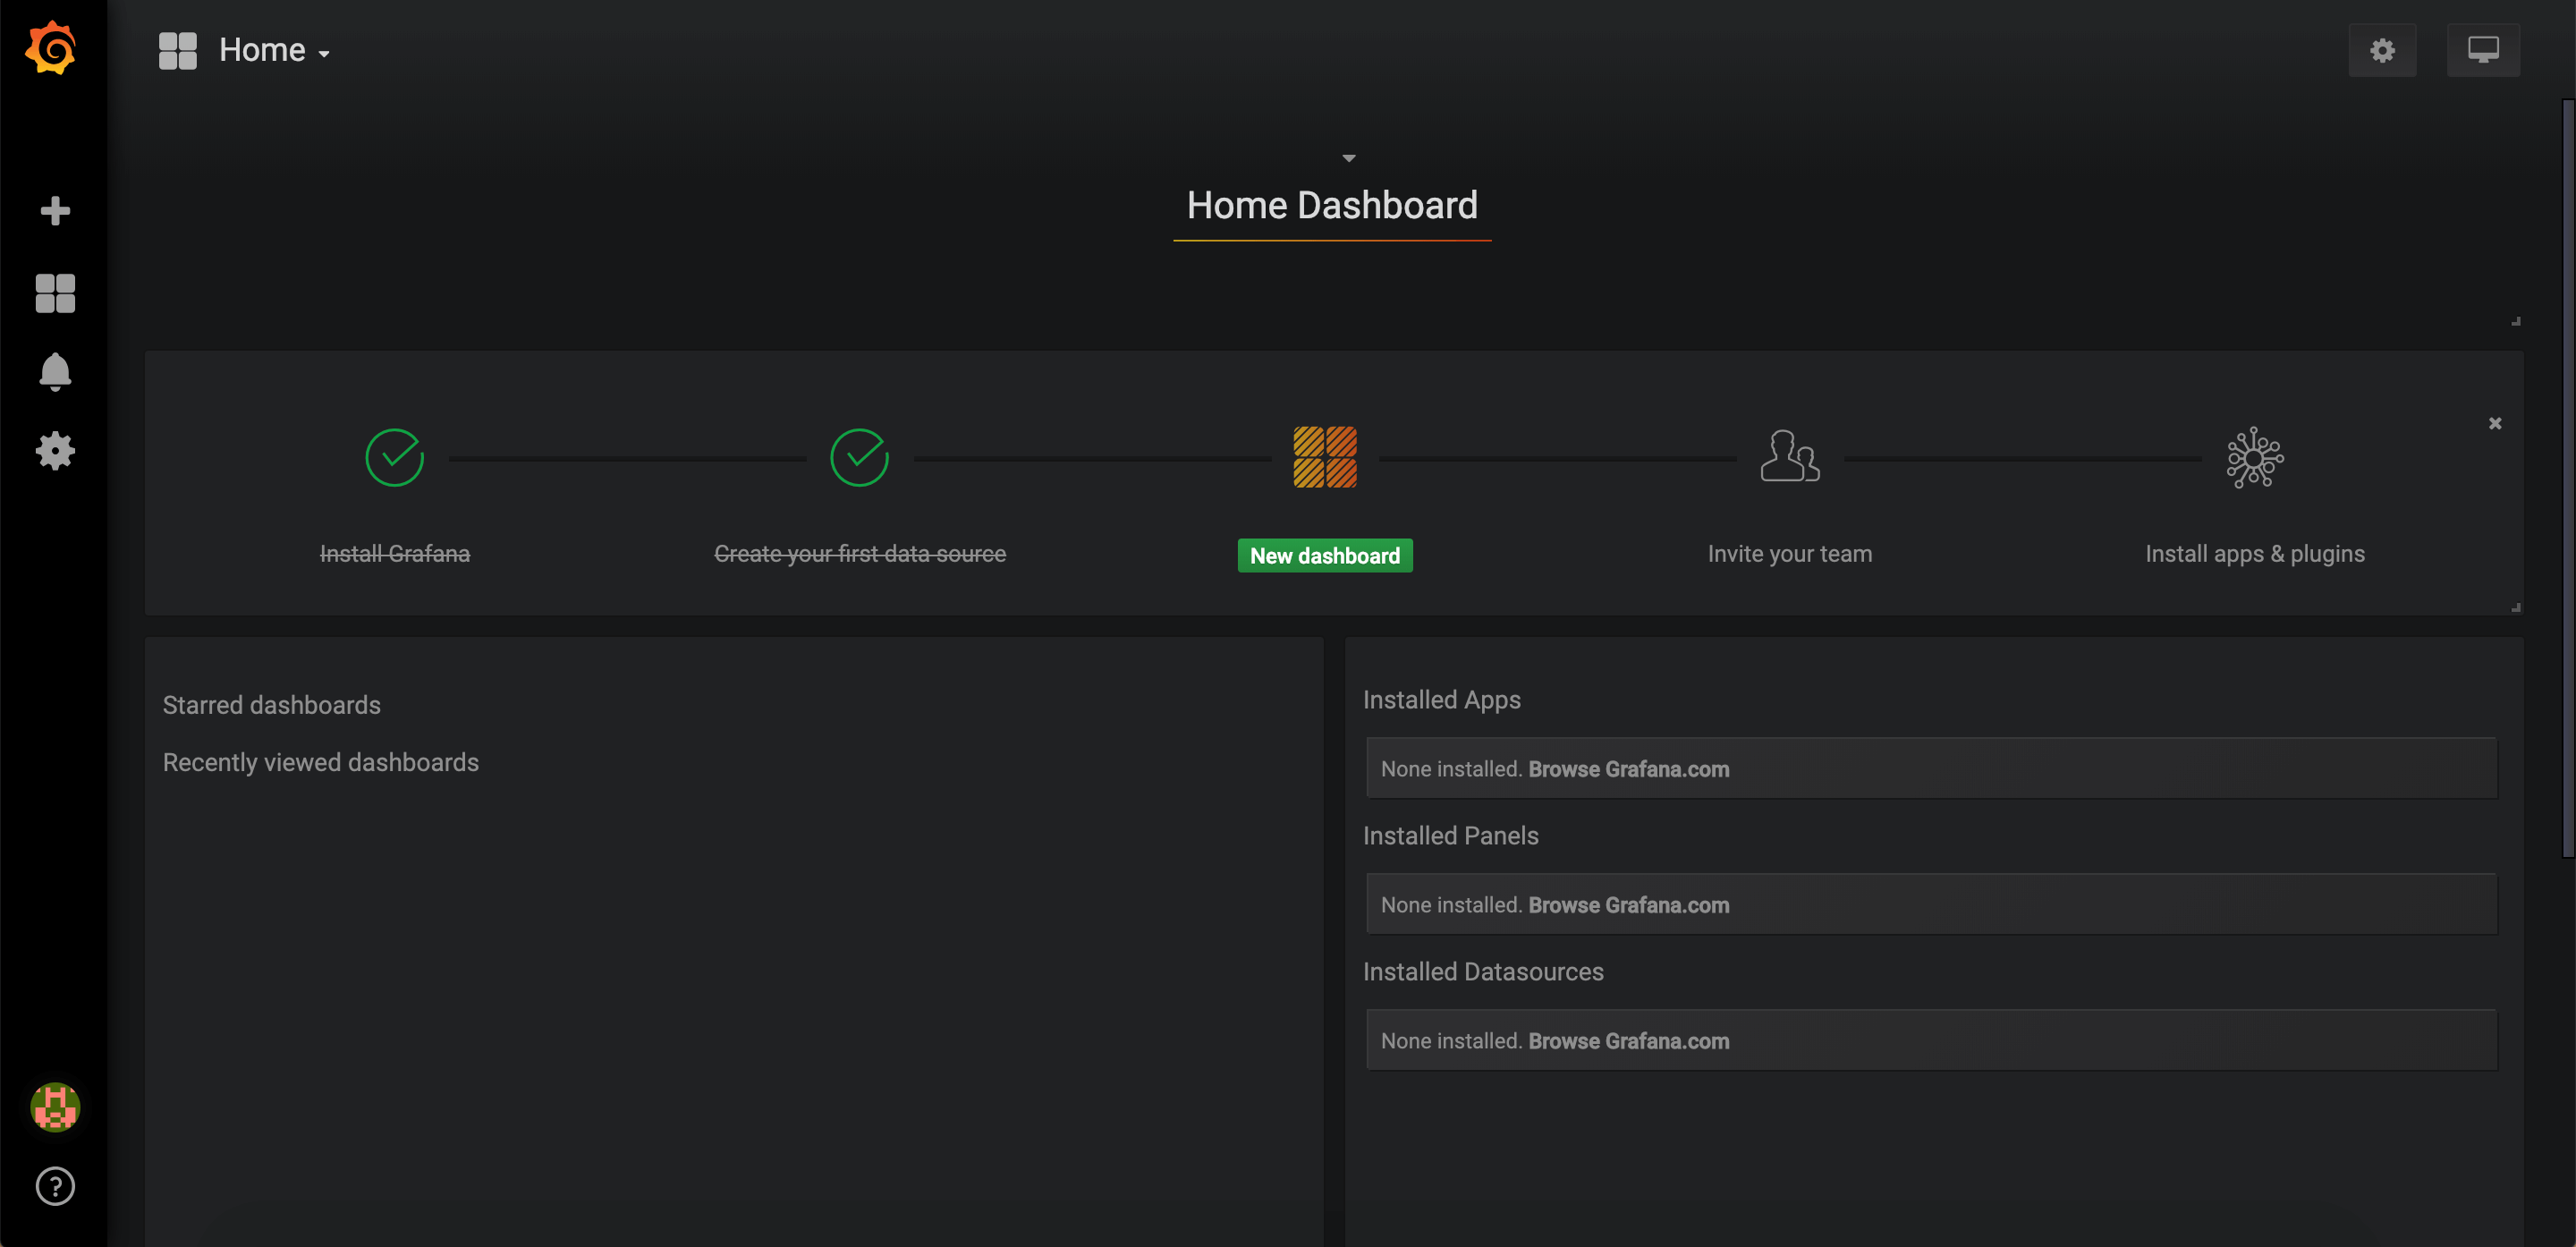
Adding Dashboard
Switch back to Grafana Dashboard and click on New dashboard.
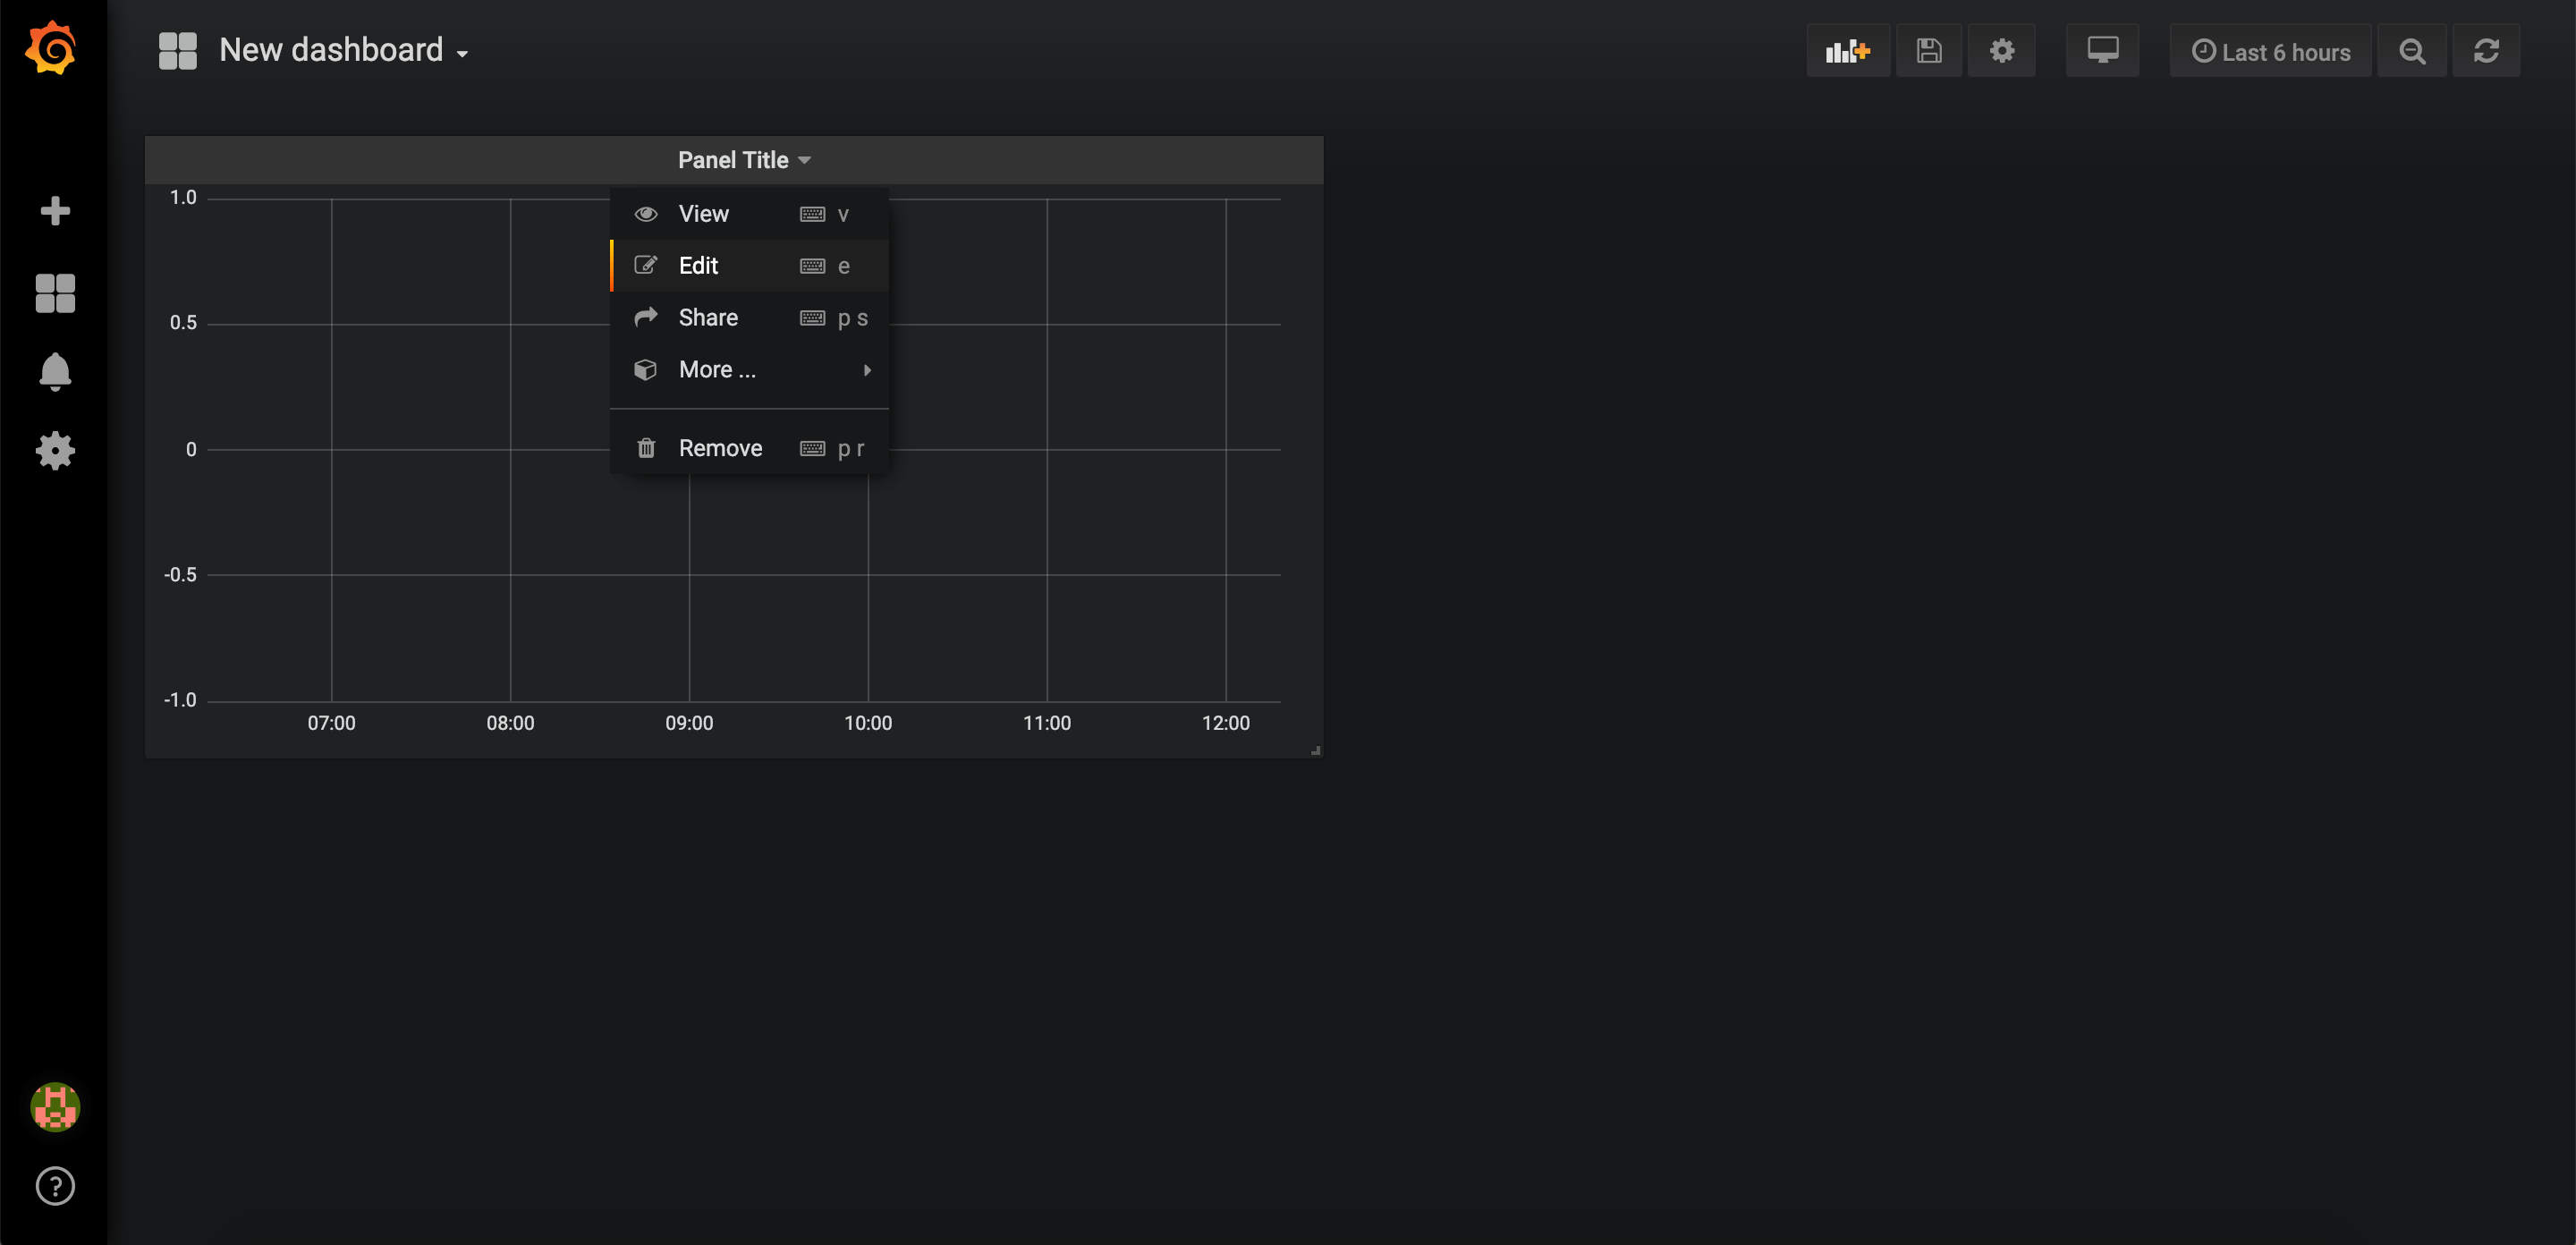
Select Graph.

Edit the graph by clicking on Panel Title > Edit.
Under Metrics tab, select Graphite as datasource and start visualizing metrics.
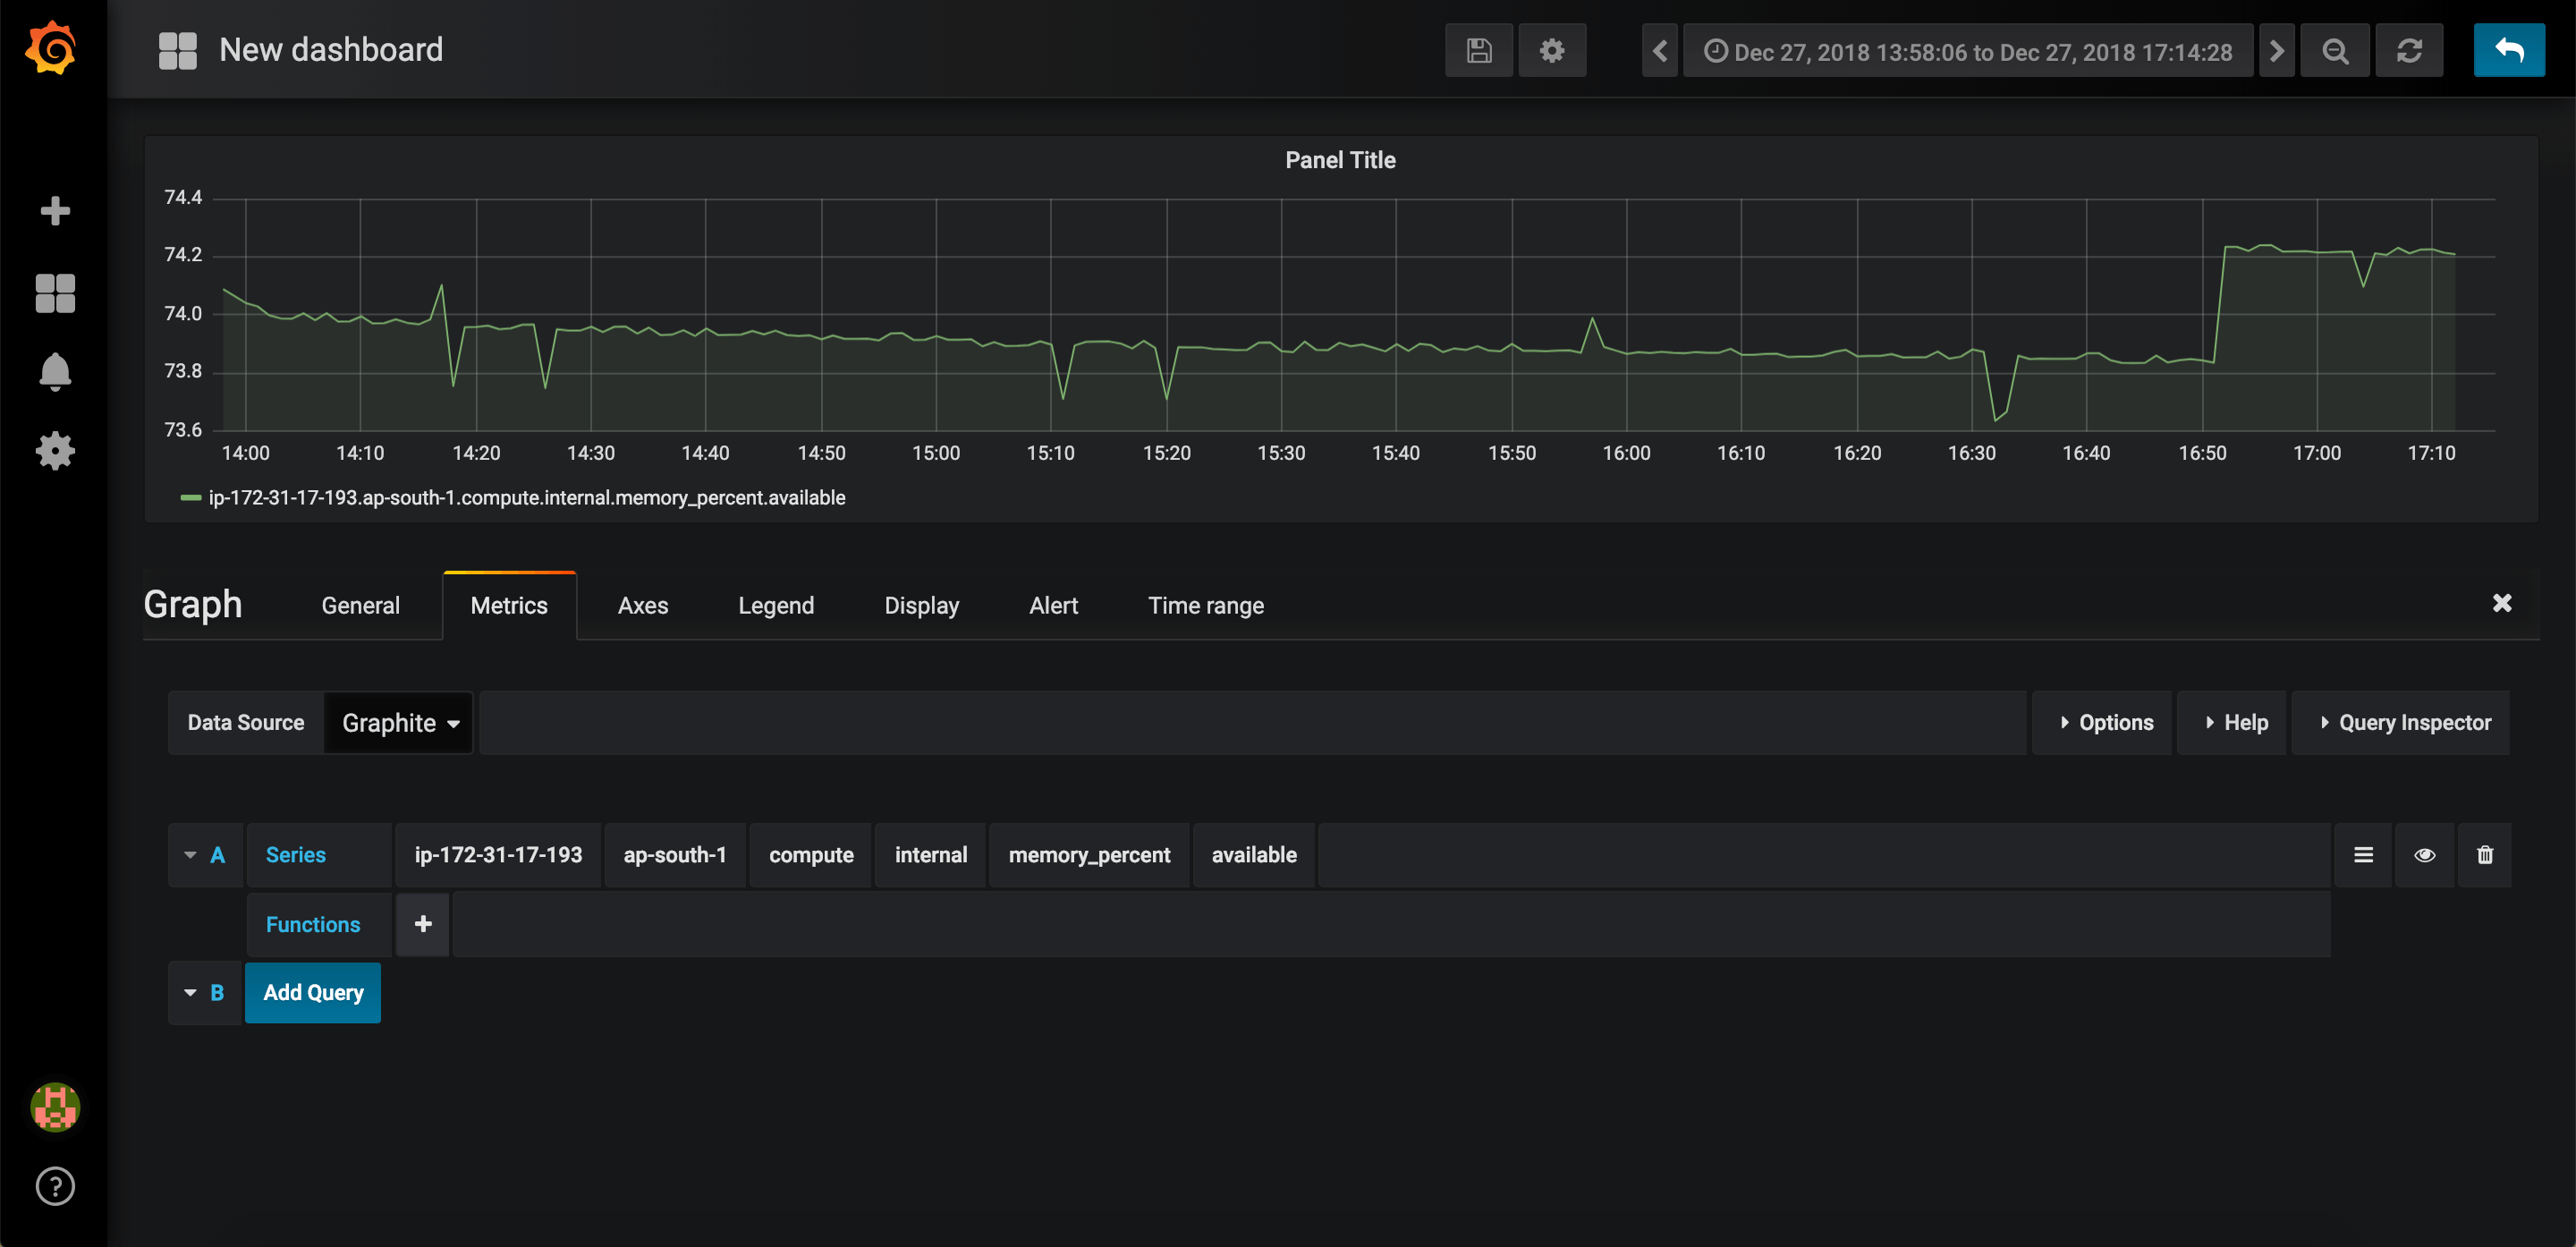
This brings us to the end of setup. We now have a Sensu Server monitoring both our linux and windows clients.
You can download the shell scripts to speed up the setup process.